Wedding Budget Breakdown by Category: What Percentage Goes Where
Quick answer: For a typical 2026 American wedding, the budget breakdown by category runs roughly: venue and catering 35-45%, photography and videography 12-18%, music 7-12%, florals 8-12%, and a wedding planner 8-15% if hired. Smaller categories like attire, stationery, cake, hair and makeup, and transportation fill in the rest, with 5-10% reserved for contingency. The full percentage breakdown by category and per-line notes are below.
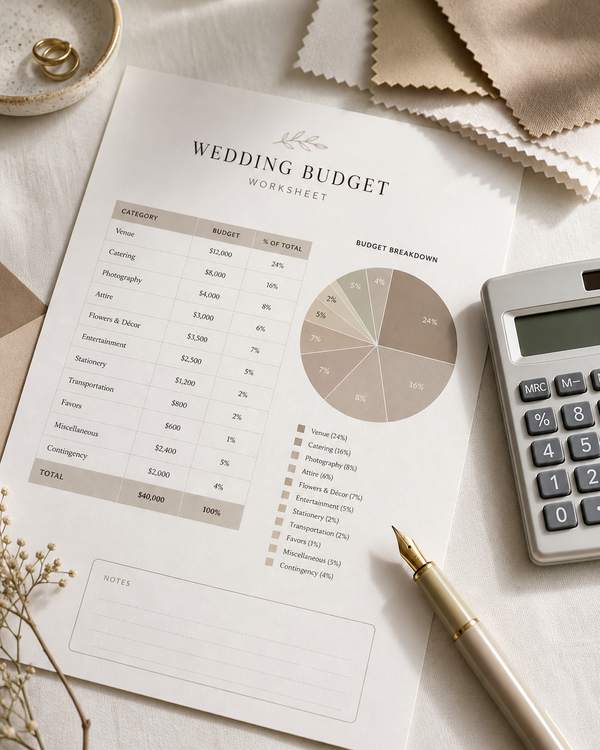
Enter your total budget for an instant 2026 dollar breakdown by category.
| Category | Share | Amount |
|---|
These are 2026 midpoints. Real ranges: venue and catering 35-45%, photography and video 12-18%, planner 8-15%. Keep 5-10% as contingency you do not spend.
Most couples start their wedding budget with a total number and no idea how to distribute it. The defaults you find online are mostly recycled from a 1990s-era allocation that does not match how weddings actually cost in 2026. The categories have shifted. Photography is more expensive than it used to be relative to other costs. Wedding planners are now a real line item. Catering has compressed against rising venue costs.
I owned a flower shop in suburban Chicago for fifteen years and priced roughly six hundred weddings during that time. From the inside, I had visibility into not just my own line item but into where the rest of the budget was going. The patterns were consistent across the years. Couples who allocated by these patterns ran their weddings smoothly. Couples who under-allocated to certain categories or over-allocated to others ran into trouble in predictable ways.
What follows is the percentage breakdown that actually works in 2026, with notes on why each category gets the share it does and where the common over- and under-spend mistakes happen.
The wedding budget breakdown by category (2026 percentages)
For a typical $40,000-$80,000 American wedding, here is the percentage range each category typically falls into. The numbers shift somewhat at the very-high or very-low budget extremes, but this is the working baseline.
| Category | Percent of total |
|---|---|
| Venue and catering | 35-45% |
| Photography and videography | 12-18% |
| Music (DJ or band) | 7-12% |
| Florals | 8-12% |
| Wedding planner | 8-15% (if hired) |
| Attire (dress, suit, alterations, accessories) | 5-10% |
| Transportation | 1-3% |
| Stationery and signage | 2-4% |
| Cake and desserts | 1-3% |
| Hair and makeup | 1-3% |
| Officiant fee | 0.5-2% |
| Rentals (chairs, linens, structures beyond catering scope) | 2-5% |
| Favors | 0-2% |
| Wedding rings | 3-5% (often not counted in wedding budget proper) |
| Contingency / miscellaneous | 5-10% |
The percentages add to more than 100% because not every couple has every category and the ranges overlap. In practice, you pick which categories you have and adjust the percentages within those.
How to think about each category
A walkthrough by line item with the practical notes I would give a couple at a budget consultation.
Venue and catering (35-45%)
The biggest single category. Often combined because venues with in-house catering quote the two together.
Where couples over-spend: choosing a venue with a high in-house catering minimum that is more food than the guest count needs. Some venues require a $150-per-person catering spend that is hard to fully use at smaller weddings.
Where couples under-spend: ignoring service charge and tax in the per-person calculation. The advertised $135-per-person quote becomes $175-per-person all-in once service and tax are added. Build the all-in number when comparing venues.
For the catering breakdown, see Wedding Caterer Types and Costs.
Photography and videography (12-18%)
The single most under-budgeted category in modern weddings. The wedding-day photos last forever; the photographer is the line item that the couple interacts with the longest after the wedding ends. Skimping here regrets later.
Where couples over-spend: hiring at the high end of their bracket without checking that the photographer's portfolio matches their venue and aesthetic. Premium pricing is not a quality guarantee.
Where couples under-spend: hiring a part-time or hobbyist photographer to save money. The work is lower-quality, less reliable, and lacks backup planning. Spend at least $4,000-$5,000 on photography for a 100-guest wedding; spend more for larger events.
For the photographer selection process, see How to Choose a Wedding Photographer.
Music (7-12%)
DJ in the lower part of the range, band in the upper. The split depends on which category you choose and how central music is to your wedding.
Where couples over-spend: hiring a budget band ($4,500-$5,500) thinking it is a status upgrade from a DJ. The result is usually worse than a $2,500 quality DJ.
Where couples under-spend: hiring the cheapest DJ on the assumption that any DJ is interchangeable. They are not. The dance floor is one of the energy markers of the night; the DJ is the difference between a packed floor and an empty one.
See DJ vs Band: Deciding the Wedding Music Vendor.
Florals (8-12%)
The line item I priced for fifteen years. Range varies by design ambition (8% for a simple wedding with mostly seasonal stems and modest centerpieces; 12% for a wedding with substantial ceremony installations and elaborate centerpieces).
Where couples over-spend: ornate aisle florals that nobody photographs after the ceremony. The aisle markers are the most over-budgeted floral category.
Where couples under-spend: the bridal bouquet. This is the most-photographed floral element of the wedding. Spend $350-$500 here, even if other floral budgets are tight.
See Wedding Florist Budget: What 2026 Pricing Actually Looks Like and our sister site Local Florists' How to Choose a Florist for Your Wedding.
Wedding planner (8-15% if hired)
The percentage assumes you are hiring at all, and the range covers day-of coordination through full-service planning. If you are not hiring a planner, this category is zero. If you are hiring full-service, the planner can be 12-15% of the total.
Where couples over-spend: hiring a full-service planner for a wedding that only needs partial planning. The price gap between tiers is significant; pay for the level you actually need.
Where couples under-spend: skipping a day-of coordinator entirely. The $1,500 day-of coordinator is one of the highest-leverage spends in the wedding budget; without one, the bride and groom or their families end up running the day instead of being celebrants.
See What a Wedding Planner Actually Does.
Attire (5-10%)
Wedding dress, alterations, accessories, groom's attire, sometimes wedding-party attire (depending on whether the couple is paying for that or not). The range varies wildly with what kind of dress and where it comes from.
Where couples over-spend: a designer dress that requires extensive alteration, raising the all-in cost significantly above the dress sticker price.
Where couples under-spend: alterations. A quality dress with bad alterations photographs worse than a moderate dress with great alterations.
Transportation (1-3%)
Limos for the wedding party, shuttles for guests at hotel-block weddings, vintage cars for the bride and groom. Most weddings spend modestly here; some destination or large weddings spend significantly more.
Where couples over-spend: vintage-car rental for a single 30-minute trip from ceremony to reception. A $1,200 line item for a single short ride is questionable.
Where couples under-spend: skipping guest shuttles when guests are spread across multiple hotels. Guests stuck without transportation reflect poorly on the wedding logistics.
Stationery and signage (2-4%)
Save-the-dates, invitations, RSVP cards, programs, escort cards, table numbers, signage for the day. Custom or letterpress can spike this category significantly.
Where couples over-spend: custom letterpress for everything. Beautiful but expensive; consider whether the line items beyond the invitation justify the upgrade.
Where couples under-spend: rarely. This is one of the categories where the standard allocation usually matches actual spend.
Cake and desserts (1-3%)
Wedding cake, optional dessert table or station, cupcakes if used. Rarely the largest line item.
Where couples over-spend: ornate multi-tier cakes with custom decorating that nobody finishes eating. Big cakes have big leftovers.
Where couples under-spend: dessert variety. A single wedding cake can leave guests with one option; a dessert table with three or four choices is often more popular.
Hair and makeup (1-3%)
Bride's hair and makeup, sometimes covered for bridesmaids and the mother of the bride, sometimes a la carte. Trial appointments are part of this budget.
Where couples over-spend: covering full hair and makeup for an entire bridal party. Lovely gesture but adds up; consider whether bridesmaids should pay for their own.
Where couples under-spend: skipping the trial appointment. The $150-$300 trial is what ensures the wedding-day result matches your expectations.
Officiant fee (0.5-2%)
Often $200-$800 for a non-religious officiant. Religious officiants may decline payment in favor of donations to their congregation. Friend-officiants may ask for a small thank-you gift only.
Where couples over-spend: rarely. Officiants are typically modestly priced.
Where couples under-spend: tipping. The officiant's fee does not include a tip; a $100-$300 tip on top of the fee is appropriate for a quality service.
Rentals (2-5%)
Chairs (sometimes provided by venue), linens (sometimes provided by caterer), upgraded tableware, dance floor, lighting, structures for outdoor events. Variable by venue scope.
Where couples over-spend: upgrading chairs from a standard reception chair to a Chiavari or Tiffany chair when the standard chair was fine. The chair upgrade adds up at $5-$8 per chair times 150 chairs.
Where couples under-spend: lighting. Good lighting is one of the highest-leverage rentals; bad lighting kills photos and dance floor energy. Spend modestly but spend.
Favors (0-2%)
Edible favors, small gifts, donation-in-lieu-of-favors. Modern weddings often skip favors entirely, which is fine.
Where couples over-spend: custom-printed favors that guests do not take home. The actual take rate on wedding favors is often 50-60%; the rest are left on tables.
Where couples under-spend: rarely. Skipping favors entirely is acceptable now.
Contingency (5-10%)
The line item nobody plans for and everyone needs. Tip overages, last-minute additions, vendor adjustments, weather contingencies, small purchases the day-of. Build this in or you will over-run the rest of the budget. Before you sign vendor agreements that lock in these costs, keep copies of every contract and deposit receipt; the FTC's guide on solving problems with a business explains why those documents matter if a vendor dispute comes up.
How to allocate when you are starting
The practical approach.
- Lock in your total budget. Real number, after honest conversation with anyone funding the wedding.
- Subtract contingency upfront. Take 8-10% off the top and reserve it. The remaining 90-92% is what you actually allocate.
- Lock in venue and catering first. The biggest line item. Get three quotes (or the venue's in-house catering quote if no choice). Let this category settle first because everything else flexes around it.
- Allocate photography and music next. These are the second-tier line items and the ones with the longest-lasting impact (photos) or highest-leverage day-of impact (music).
- Build out floral, planner, and attire. The mid-tier categories.
- Fill in the smaller categories. Stationery, cake, hair and makeup, officiant, transportation, favors.
- Recalculate. If categories total to more than 90-92%, the over-allocation has to come from somewhere. The honest move is to cut from one category, not to push contingency lower.
What I tell couples who ask me
The wedding budget conversation is the most important conversation in wedding planning. Couples who do it carefully and honestly run smooth weddings. Couples who avoid it run weddings that go over budget and create stress in the months before.
The categories above are the framework. The percentages are the working baselines. Adjust based on your priorities. If photography is everything to you, push that category up to 18-20% and trim from elsewhere. If your venue is unusually expensive, accept that other categories will compress.
The trap to avoid: assuming you will not need contingency. You will. Reserve it.
Frequently Asked Questions
What is the typical wedding budget breakdown by percentage?
A typical 2026 wedding budget breaks down by category roughly like this: venue and catering 35-45%, photography and videography 12-18%, music 7-12%, florals 8-12%, a wedding planner 8-15% if hired, attire 5-10%, and 5-10% held back for contingency. Smaller line items (stationery, cake, hair and makeup, transportation, officiant, favors) each take 1-4%. You apply the percentages only to the categories you actually have, then adjust within them based on your priorities.
What percentage of a wedding budget goes to venue and catering?
Venue and catering is the largest category, taking 35-45% of the total budget. Venues with in-house catering usually quote the two together, and the per-person figure should always be built as an all-in number that includes service charge and tax. A quoted $135 per person can land near $175 per person once those are added.
How much should I spend on wedding photography?
Photography and videography typically run 12-18% of the budget, and it is the single most under-budgeted category in modern weddings. For a 100-guest wedding, spend at least $4,000-$5,000 on photography, and more for larger events. The photos outlast every other line item, so this is not the place to hire a hobbyist.
Do I need to budget for a wedding planner?
Only if you hire one. A planner runs 8-15% of the total, from day-of coordination at the low end to full-service planning at the high end. If budget is tight, a roughly $1,500 day-of coordinator is one of the highest-leverage spends, because it keeps the couple and their families from running the day instead of enjoying it.
How much should I set aside for unexpected wedding costs?
Reserve 5-10% of the total budget as contingency, and subtract it off the top before you allocate anything else. It covers tip overages, last-minute additions, vendor adjustments, and weather contingencies. The most common trap is assuming you will not need it. You will.
Further reading
For specific vendor-category selection guides, see How to Choose a Wedding Photographer, What a Wedding Planner Actually Does, Wedding Florist Budget: What 2026 Pricing Actually Looks Like, DJ vs Band: Deciding the Wedding Music Vendor, and Wedding Caterer Types and Costs. For broader vendor red flags, see Red Flags When Interviewing Wedding Vendors. For the booking timeline, see When to Book Each Wedding Vendor.
The Wedding Report publishes annual wedding-cost data by region, useful for benchmarking your budget against actual spending in your area.